Things have been mellow up here at the lake through the end of winter and into early spring, as commonly occurs, but we are seeing an increase in buyer activity and showings in the Lake Tahoe Nevada real estate sector in the past few weeks as the weather warms up. Things are usually more quiet through winter as it is, but the lack of snow for the ski resorts this year was definitely felt in the number of showings on listings and buyers actually in the area to look at property. That being said, looking at the below statistics & graphs, things are shaping up nicely going into summer!
**This data applies to all areas of Lake Tahoe, Nevada with the exception of Incline Village which has it’s own MLS and statistics–if you are interested in data for the Incline Village, Nevada area we are happy to connect you with a great Realtor to assist you with your Incline real estate needs**
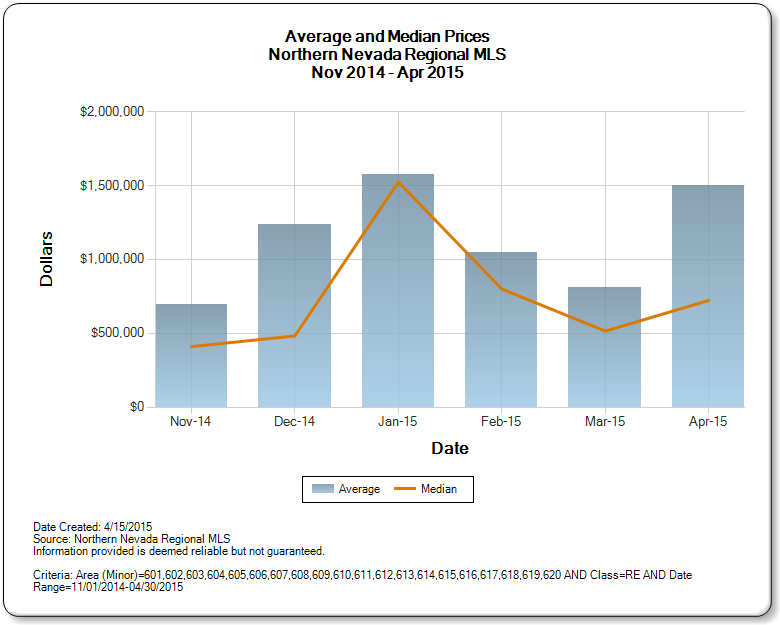
Lake Tahoe Nevada Real Estate: Average & Median Sales Price
 From the above graph you can see the sales in February and March dropped off quite a bit…whether this coincided with our severe drop off in snow for the ski resorts and summer like temperatures through those two months, or if it was just standard winter quiet market, it does look like the upper end sales are picking back up again already through the first half of April. In January the median sales price soared and was primarily driven by the fact that of the 10 residential sales, 6 of them were above a million with one at $2.8mil and another at $3.8mil. February by contrast had only 5 sales with only 2 of those above a million. Volume of sales did pick up in March with 11 sales with 2 above a million. April as you can see is off to a nice start with 8 sales to date for the month and we are only halfway through, with 3 sales above a million, one of which was a beautiful lakefront property in Skyland that sold for $5.8 million.
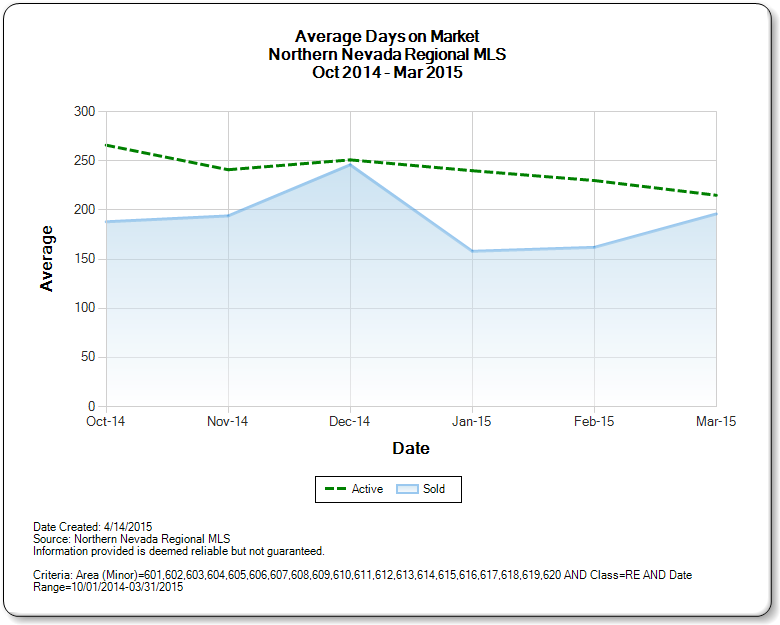
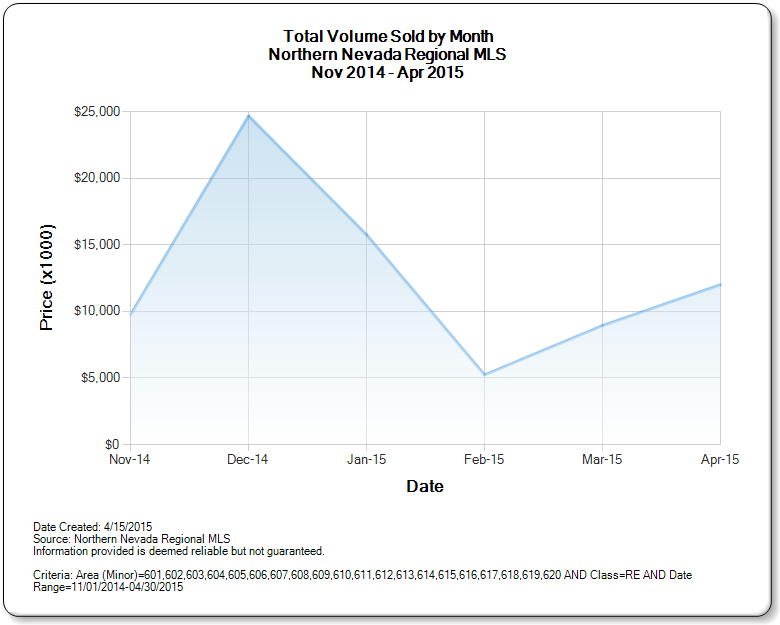
Lake Tahoe Nevada Real Estate: Average Days on Market & Volume Sold by Month
 For the sellers out there, we just thought this was a nice graph to show how long it is typically taking to sell a property on the Nevada side of the lake. While South Lake Tahoe, CA side has average days on market (DOM) significantly lower, with some neighborhoods as low as 50 DOM, the Nevada side does take a little longer to find a buyer for your home. This is not because this side of the lake is less desirable by any means! But rather the price point is typically higher so that equates to fewer buyers in the buying pool.
This graph also coincides with the first graph we posted, showing that overall volume of sales really does drop off in February but is climbing back out of that trough going into April.
All of this sets up the real estate market nicely going into summer time. We will update these statistics in early summer to see where the trend continues as we head into the height of sales that typically occur during the summer months!
Interested in statistics for a specific neighborhood? Please don’t hesitate to ask us for a report detailed specific to your individual real estate needs, as we are happy to provide.

